Introduction
One of the most important aspects of unmanned aerial systems mission planning is the ability to assess the situation you have been given, develop a thorough plan, and communicate it to individuals and businesses that need to understand the process by which you will provide a solution for them.
- The mission plan should maximize productivity without endangering operators or equipment.
- In order to utilize the proper equipment, the mission plan should taken into account, weather, landscape, potential hazards, and the scope of the solution needed for clients.
Fixed-Wing
A fixed-wing UAS (as seen in Figure 1) is capable of flight using wings that generate lift caused by the forward air-speed of the vehicle.
Figure 1: This picture provides an example of the size of a fixed-wing UAS. This particular model takes flight after being physically released by hand into the wind.
Flight Time: up to 26 hours Speed: up to 175 mph Payload: up to 350 lb.
Capabilities Limitations
good for high altitude remote sensing limited ability to turn
long flight duration may require runway to launch or land
greater carrying capacity inability to hover
high speed for greater coverage area limited close-up inspection capability
Rotary
A rotary-wing UAS (as seen in Figure 2) uses lift generated by wings called rotor-blades (propellers) to revolve around a mast.
Figure 2: This picture provides an example of the size of a rotary wing UAS. For this particular model, four propellors revolve around masts propelling it into the air
Flight Time: up to 3 hours Speed: up to 37 mph (approx.) Payload: up to 75 lb.
Capabilities Limitations
vertical capability to hover and "stare" limited flight time
agile enough to come within feet of visual target limited payload
deliver payloads with precision low operating speed
allows perfect camera pictures and angles
each propeller can operate independently
not as effected by side-winds
good for facility inspections
more portable
vertical launch doesn't require runway
Mission Scenarios
This activity presents the following five scenarios. For each scenario we will provide a recommendation for how to configure the UAS and carry out a mission that will provide the required information to the concerned party.Mission 1: Operation Desert Tortoise
A military testing range is having problems engaging in conducting its training exercises due to the presence of desert tortoises. They currently spend millions of dollars doing ground based surveys to find their burrows. They want to know if you, as the geographer can find a better solution with UAS.
Mission 2: Operation Power Tower
A power line company spends lots of money on a helicopter company monitoring and fixing problems on their line. One of the biggest costs is the helicopter having to fly up to these things just to see if there is a problem with the tower. Another issue is the cost of just figuring how to get things from the closest airport.
Mission 3: Operation Healthy Pineapple
A pineapple plantation has about 8000 acres, and they want you to give them an idea of where they have vegetation that is not healthy, as well as help them out with when might be a good time to harvest.
Mission 4: Operation Leaky Pipe
An oil pipeline running through the Niger River delta is showing some signs of leaking. This is impacting both agriculture and loss of revenue to the company.
Mission 5: Operation Earth Removal
A mining company wants to get a better idea of the volume they remove each week. They don’t have the money for LiDAR, but want to engage in 3D analysis.
Mission Plans
For each of the five mission scenarios listed above, a mission plan has been developed. Each mission number and name will link back to the mission scenario for your review of the mission scenario.Mission 1: Operation Desert Tortoise
In order to ascertain the needs of this mission we analyzed the following aspects:- The behavioral patterns of the desert tortoise and the geologic composition of their habitat
- The area coverage required for the mission
- The cost of current measures used to locate desert tortoises
- The weather patterns affecting data collection
- The equipment necessary to locate desert tortoises
Geologic Composition
The desert tortoise spends most of its life in burrows/shelters (as seen if figures 4-6) in order to regulate body temperature and reduce water loss. Sandy loam soils are the preferred location for these burrows/shelters due to their high resistance to flooding and high water holding capacity compared to other sandy soils.

Figure 3: This is a pyramid explaining the different categorization of soils based on the quantity of silt, sand and clay it is composed of (states as a percentage). Sandy loam soil (outlined in red) consists of less than 7% clay, less than 50% silt, and between 43 and 50% sand. This soil is the preferred location for desert tortoise burrows.
Also, they are primarily found on the steep, rocky slopes of hillsides. The slopes may be littered with granitic or volcanic boulders and are often covered with dense vegetation. The palo verde-saguaro cactus is the most frequently occupied habitat, although some tortoises are found in oak woodlands and dense stands of bunch grass.
Vegetation
In addition, their burrows tend to be located in areas containing wildflowers such as wishbone bushes, lotus, loco weeds, spurges, blazing stars, lupines, Indian wheat, forget-me-nots, desert dandelions, gilias, phacelias, coreopsis, and many other species. They also eat annual and perennial grasses and fresh pads and buds of some species of cactus. They do not eat shrubs such as creosote bush and burro bush.
Shelter Types
Shelters for the desert tortoise can be categorized into three different types based on the resources present on the landscape and the current needs of the tortoise. These three types are burrows, rock shelters, and pallets (as seen in Figures 4-6).
Burrow

Figure 4: Built into the side of a rocky slope, this burrow represents a "permanent" shelter for the desert tortoise used in all seasons. A burrow is typically between 2.5 and 10 feet in length.
Pallet
Figure 5: This is an example of a pallet which equates to a "shallow" burrow that just barely covers the shell of the tortoise in spring, summer and fall. These temporary burrows or pallets use whatever cover is available in an area and can be fragile. They may be used for shelter for a few days while a tortoise is foraging in a particular area. A temporary burrow usually lasts from a few weeks to a season and disintegrates.
Rock Shelter

Figure 6: This is a rock shelter due to the composition of the material overhead as opposed to the sand/rock slope of the burrow in Figure 3. This is also a more permanent shelter for a desert tortoise.
Each tortoise usually has more than one burrow. In fact, desert tortoises may have between 5 and 25 burrows per year. The number of burrows the tortoise uses may depend on age and sex, as well as on the season. When burrows are constructed in soil, they are the size and shape of the tortoise -- half moon for the roof and flat on the bottom. Small tortoises have small burrows and large tortoises have large burrows.
Relevant Observations for Mission Planning
Based on these observations regarding the behavioral patterns of the desert tortoise our mission plan to locate desert tortoises will take into account the following geological and geographical features:
- Sandy Loam as the ideal soil for desert tortoise burrows
- The presence of vegetation such as grasses, wildflowers, and cacti as essential to the location of desert burrows due to dietary needs
- Tendency for shelters to be located along rocky slopes
- Variation of desert tortoise shelters into three categories - burrows, pallets and rock shelters
While we have not been given information about the size of the military testing facility, based on the nature of operations at such a site, it is safe to assume a wide coverage area. Collecting data from a large circumferential area will require an unmanned aerial system with long flight range. It will also be preferential for the UAS to be capable of high speeds to complete a mission of this magnitude in a reasonable amount of time.
With a coverage area of this scope, it is important to make use of ground control points. Ground control points are points on the surface of known location. These locations are normally found by measuring the coordinates using a GPS. These points will allow us to geo-reference the image during post mission analysis.
Cost of Current Methods for Locating Desert Tortoises
From the information we have been supplied, the cost of locating desert tortoises currently is in the millions of dollars. Every time military testing takes place, data must be collected and desert tortoise location determined. Due to the high costs associated with such an endeavor options such as LiDAR remote sensing technology and high resolution photography equipment should be considered if additional precision can be gained through their use.
Weather Patterns Affecting Data Collection
Every time that military testing takes place, it is required that the location of all desert tortoises be determined. Because desert tortoises will have between 5 and 25 burrows that, potentially, vary from year to year, data collection will take place on a regular basis. As such, weather is not a long-term consideration. Data collection will take place subject to the needs of the military testing facility as opposed to the ideal long-term timing of data collectors such as seasonal considerations.
However, in the short-term, the absence of factors such as rain, strong winds, and low visibility conditions will be required for the accurate collection of data.
Equipment Options for Data Collection
This section will be used to present the abilities of equipment options available for accurate data collection based on the details of this project. How they will be used will be discussed in the Mission Plan.
This will include unmanned aerial system options as well as sensors, cameras, GPS units, or other data collection options recommended.
Unmanned Aerial System
Fixed-Wing Aircraft
Falcon Eye fixed-wing UAV
A fixed-wing UAS (as seen in Figure 1) is capable of flight using wings that generate lift caused by the forward air-speed of the vehicle.
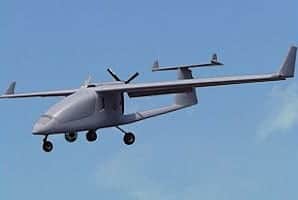
Figure 7:This is a picture of the Falcon Eye fixed-wing UAS . This particular model requires a runway for launch.
Flight Time: up to 24 hours Speed: up to 112 mph
Cruising Altitude: up to 18000 ft. Payload: up to 220 lb. Capabilities Limitations
good for high altitude remote sensing limited ability to turn
long flight duration may require runway to launch or land
greater carrying capacity inability to hover
high speed for greater coverage area limited close-up inspection capability
Reasons for Selecting this UAS
Due to the significant coverage area required to collect data from, a fixed wing UAS, such as the Falcon Eye will be necessary. Whereas rotary UAS models only have up to 3 hours of flight time, this fixed-wing aircraft will allow up to 24 hours of flight time for data collection. In addition, at a speed of 112 mph, the Falcon Eye will be able to collect data in a reasonable amount of time. Because data collection will take place at a military testing facility, it is understood that a runway will be available.
Hyperspectral Imaging Sensor
A hyperspectral imaging sensor (as seen in Figure 8) collects and processes information from across the electromagnetic spectrum.

The hyperspectral imaging sensor divides light into many bands including the visible spectrum and those beyond the range of the human eye including infrared, ultraviolet, etc. (as seen in Figure 9).

Figure 9: This is a diagram of the bands of the electromagnetic spectrum as viewed by hyperspectral imaging sensors. As stated on the diagram, vegetation can be differentiated in the Red Band of the spectrum. Soil types can be discriminated in the Longwave Infrared Band. Using the hyperspectral signature attached to the soil and vegetation types we are looking for, we will be able to locate potential desert tortoise burrows.

Figure 10: This chart shows how different features such as grass, soil, and water reflect different percentages of light and thus can be identified. By locating specific areas of vegetation we will be able to narrow down the potential locations of desert tortoises.

Figure 11: This chart shows the reflectance patterns specific to Sandy Loam variations. Through hyperspectral remote sensing, the location of all sandy loam in the area in question will be located for the identification of desert tortoise burrows.
Post Mission Analysis
Aerial images taken during the mission will be imported into a remote sensing program in which the desired spectral signatures can be measured, identified and differentiated. Using our predetermined ground control points, we can anchor down certain locations on the aerial imagery in order to establish a coordinate system. Once these signatures have been located, the images can then be imported and projected into a GIS in order to find the coordinates of potential desert tortoise habitats.
***ADJUSTMENT TO CURRENT FORMAT***
The extent of this mission planning exercise has been exceeded as far as what you see in mission 1. As a result my instructor has advised providing only the essential details as far as what sensors, UAS, and other equipment recommended to complete the mission.
Mission 2: Operation Power Tower
For Operation Power Tower, a UAS is needed to examine various power lines and electrical towers. We decided that a rotary UAS will be the preferred method in order to hover and stare at various components on each electrical power. A small high resolution camera will be mounted onto the UAS in order to provide a live video feed to the pilot and concerned party. UAS mission planning software will be used to set predetermined stops at each tower to minimize flight time and maximize mission efficiency due to the short battery life of the rotary UAS.
Mission 3: Operation Healthy Pineapple
Operation Healthy Pineapple required an analysis on the health of a large scale pineapple plantation. Because this mission will be covering a distance of 8000 acres, it calls for a long flight duration and high altitude, which makes a fixed wing UAS the ideal vehicle. In order to measure the health of the pineapple, a multispectral sensor will be mounted to the UAS. This sensor will allow us to examine the different spectral signatures found within the red band of the visible spectrum to identify healthy pineapple and unhealthy pineapple.
To determine the optimal harvest time for pineapple, it is recommended that multiple data collection runs be made over the course of the standard harvesting season.
Mission 4: Operation Leaky Pipe
Operation Leaky Pipe involves locating the source of oil pollution within the Niger River Delta. To find this information, we will be using a two stage process including two different UAS vehicles. The first stage of the mission will require a fixed wing UAS equipped with a hyperspectral scanner to locate areas of oil pollution in the river delta using the green band of the visible spectrum and potential areas of impacted crops using the red band. By using remote sensing software, areas with these spectral signatures will be located in the river delta until the furthest location of pollution upriver is found.
In the second stage of the mission a rotary UAS will hover to the upriver location identified by the fixed wing UAS. The rotary UAS will be equipped with a small high resolution camera which will provide a live feed to the pilot and concerned parties and a GPS unit in order to locate the oil leak. Locating the oil leak will also help us understand the scope of crop damage than can be attributed to the oil leak as opposed to damaged crops further upstream.
Mission 5: Operation Earth Removal
Operation Earth Removal required volumetric analysis in order to measure the amount of material removed from the mine each day. Using a rotary UAS will allow us to adjust the vehicle until we find the desired elevation and angles that will provide the most accurate measurements to calculate volumetric output. At the end of each workday, the UAS will fly over the mine and generate point cloud data using a point cloud sensor. Point cloud data can be used to generate a 3D representation of the mine, which can be compared to the mine measurements of the previous day to determine the difference in volume.
***ADJUSTMENT TO CURRENT FORMAT***
The extent of this mission planning exercise has been exceeded as far as what you see in mission 1. As a result my instructor has advised providing only the essential details as far as what sensors, UAS, and other equipment recommended to complete the mission.
Mission 2: Operation Power Tower
For Operation Power Tower, a UAS is needed to examine various power lines and electrical towers. We decided that a rotary UAS will be the preferred method in order to hover and stare at various components on each electrical power. A small high resolution camera will be mounted onto the UAS in order to provide a live video feed to the pilot and concerned party. UAS mission planning software will be used to set predetermined stops at each tower to minimize flight time and maximize mission efficiency due to the short battery life of the rotary UAS.
Mission 3: Operation Healthy Pineapple
Operation Healthy Pineapple required an analysis on the health of a large scale pineapple plantation. Because this mission will be covering a distance of 8000 acres, it calls for a long flight duration and high altitude, which makes a fixed wing UAS the ideal vehicle. In order to measure the health of the pineapple, a multispectral sensor will be mounted to the UAS. This sensor will allow us to examine the different spectral signatures found within the red band of the visible spectrum to identify healthy pineapple and unhealthy pineapple.
To determine the optimal harvest time for pineapple, it is recommended that multiple data collection runs be made over the course of the standard harvesting season.
Mission 4: Operation Leaky Pipe
Operation Leaky Pipe involves locating the source of oil pollution within the Niger River Delta. To find this information, we will be using a two stage process including two different UAS vehicles. The first stage of the mission will require a fixed wing UAS equipped with a hyperspectral scanner to locate areas of oil pollution in the river delta using the green band of the visible spectrum and potential areas of impacted crops using the red band. By using remote sensing software, areas with these spectral signatures will be located in the river delta until the furthest location of pollution upriver is found.
In the second stage of the mission a rotary UAS will hover to the upriver location identified by the fixed wing UAS. The rotary UAS will be equipped with a small high resolution camera which will provide a live feed to the pilot and concerned parties and a GPS unit in order to locate the oil leak. Locating the oil leak will also help us understand the scope of crop damage than can be attributed to the oil leak as opposed to damaged crops further upstream.
Operation Earth Removal required volumetric analysis in order to measure the amount of material removed from the mine each day. Using a rotary UAS will allow us to adjust the vehicle until we find the desired elevation and angles that will provide the most accurate measurements to calculate volumetric output. At the end of each workday, the UAS will fly over the mine and generate point cloud data using a point cloud sensor. Point cloud data can be used to generate a 3D representation of the mine, which can be compared to the mine measurements of the previous day to determine the difference in volume.
No comments:
Post a Comment