Introduction:
Emphasis
Field Activity #1 emphasizes critical thinking skills and the ability to implement improvisedsurvey techniques.
Instructions
- Construct an elevation surface of terrain in a garden planter box (See Figure 1) including the following terrain types.
- Ridge
- Hill
- Depression
- Valley
- Plain
- Survey the elevation surface with rudimentary tools such as a measuring type and meter stick.
- Record the results of the survey in a spreadsheet containing X, Y, and Z fields for later entry in ArcGIS.

Figure 1: Garden planter box in which we were to build our elevation surface
Methods:
Elevation Surface Construction
"Snow or Sand?"As you can see in Figure 1, January and February, 2014 provided us with an ample amount of snow. That and the cold temperatures made it an easy decision to construct our elevation surface out of snow rather than the rock solid sand beneath it.
"Build up or Down?"
Next we had to decide whether to build "up" or "down." At first, the large amount of snow made it seem like it would be easiest to build up from the top board enclosure of the planter box and use the enclosure as the base-level. However, we felt that this would lead to imprecise measurements if we were trying to determine the height of that outer edge when we were measuring in the middle of the planter. We concluded it would be best to use the top edge of the enclosure as our maximum height. This meant we would measure down from the top to determine the elevation profile.
Physical Feature Placement
The actual construction of our six terrain types required us to get our hands dirty (or, at least, cold) as can be seen in Figure 2. We did our best to recall our Geography 104 (Physical Geography) course in order to place features where you would typically expect them to be.

Figure 2: Physical construction of the elevation surface
Terrain Survey
Equipment SelectionAfter studying the methods used in the Geographic Field Methods class from 2013, we decided to use push pins and string to develop a grid system from which to taken measurements.
Interval Selection
Again, building on the work from Geographic Field Methods - 2013, we noticed that some of the groups initially started with 10x10 cm. grid squares. Later they wished they had used smaller intervals. Therefore, we decided to start with 5x5 cm. grids in hopes of avoiding a re-survey.
Grid Construction
Armed with our selected intervals, we used a meter stick to mark our 5 cm. intervals around the enclosure board of the garden planter box as seen in Figure 3.

Figure 3: Push pins were used to mark 5 cm. increments on the outer edge of the garden planter box
Next, we divided the area of our garden planter box by running string across the box at our 5 cm. intervals until we arrived out our finished project as seen in Figures 4-6.

Figure 4: String was extended from corresponding 5 cm. increment pins to create our grid structure

Figure 5: View of string extension across the garden planter box

Figure 6: Final 5x5 cm. grid pattern view from the top
Terrain Elevation Measurement
Logistics
As previously mentioned, our next step was to measure down from the top of the grids to the terrain beneath. In order to ensure consistent measurement, we measured from the "southwest" corner of each grid using a meter stick. Because we were dealing with a hypothetical terrain. We chose our north, south, east, and west directions without regard to actual direction. Figure 7 is labeled with the direction we chose for north
North
Figure 7: North is labeled at the top of this photo. Measurements were taken from the southwest corner of each grid.

Figure 8: Using a meter stick, measurements were taken from the top of the grid to the height of the surface below at the southwest corner of each grid
Measurement Process
Every precaution was taken to ensure accurate measurements in spite of the less than ideal methods available to us. As seen in figure 9, one person measured distance from the top of the grid to the elevation height below, one person stabilized the meter stick in the southwest corner of the grid, and a third person called out measurements from an eye-level perspective of the top of the grid. A fourth person (not in picture) recorded the measurements in a pre-made grid diagram.
Every precaution was taken to ensure accurate measurements in spite of the less than ideal methods available to us. As seen in figure 9, one person measured distance from the top of the grid to the elevation height below, one person stabilized the meter stick in the southwest corner of the grid, and a third person called out measurements from an eye-level perspective of the top of the grid. A fourth person (not in picture) recorded the measurements in a pre-made grid diagram.

Figure 9: Ensuring accurate measurement, one person measured the height of elevation, one person stabilized the measurement location in the southwest corner, and one person called out the measurement to be recorded
Adjustments
As we took our measurements, we noticed the grid lines we had placed were not always tight. In order to account for the effect of this on our measurements we rounded them to the nearest half centimeter.
Data Entry of Results
Matters of Interpretation
Armed with the results of our survey, we undertook the painstaking process of entering our data into a Microsoft Excel spreadsheet as seen in image . At first, this might seem mind-numbing, but we soon realized this would take a little bit of thought. Two different people added the raw data; one recorded positive numbers, and the other recorded negative numbers as is shown in graph 1. This meant we had to re-format our data.

Graph 1: original entry of elevation measurements from the top of the grid with some positive and some negative numbers from two people's interpretation of the data. The grey column corresponds with the data row.
Establishing "sea-level"
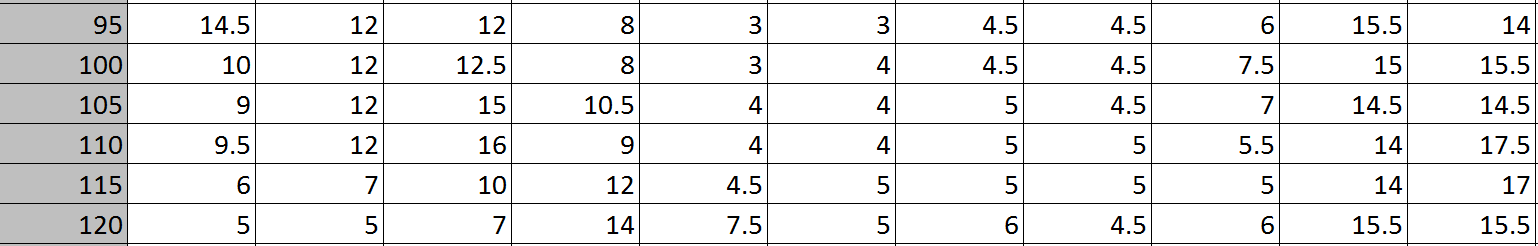
Before doing so, we also had to set a "sea-level" because we were taking measurements from the top down to terrain elevation. By looking at our results, we saw that the lowest measurement recorded was 20 cm. This became our hypothetical sea-level. Using that sea level, our measurements from the top of the grid were reformulated to show height from sea level as seen in Graph 2.

Graph 2: Reformulated data shows all positive values as measure "up" from 20 cm depth (sea-level) to the top of our grid as opposed to positive and negative measurements "down" from the top of the grid..
Translation to X,Y, Z coordinates
The final step of our data entry was to take our pre-survey grid with numbered x and y coordinates and combine them with our measured z coordinates in an excel table as seen in graph 3.

Graph 3: This is the translation of our grid data points into X, Y, and Z coordinates for future entry into ArcMAP
Discussion/Conclusion:
(Due to the detailed nature of the Methods section and the relative lack of results associated with the first portion of this exercise, I have combined these two sections into 1.)
Overview
This exercise presented some very unique challenges in all three steps (elevation surface construction, terrain elevation measurement, and data entry of results) of the process. It truly showed the intentional manner in which decisions must be made while doing field work in order to ensure the accuracy, precision, and consistency of data collected.
Assess and Plan Properly
More important than the "doing" of fieldwork is the development of your methods and the reasons for them. Assessing the situation and developing a solid plan prepares allows you to address the variability you will inevitably encounter in the field. Fortunately, the group I worked with saw the value of these measures and stuck to them.
Be Fluid and Creative
I can definitely see how electronic measures to ascertain the elevation profile of our garden planter box. However, I can also the value in being able to creatively develop solutions without ideal tools.
Reflect and Learn
There were times where our group created extra work by failing to talk things through. For instance, the data points being entered in positive and negative numbers was a small hiccup.
Second, we noticed that the accuracy of our height measurements many have suffered as a result of an inadequately tight grid line. We tried to account for this by rounding our height measurements to the nearest half-centimeter, but there is more room for error in this generalization.
Thirdly, we should have devised a way to better keep track of our directional choice of N, S, E, and W. We often had to regain our bearings by asking, "which way is north, again?" when entering data.
Moving Forward
In the next portion of this exercise, my group and I will be assessing the results of our initial survey. Then, we will make any necessary changes to our data based on what we have found. From there, using ArcGIS, we will develop different models displaying our elevation profile and determine which one best expresses our data.
No comments:
Post a Comment